Interface and Application Programming
Group Assignment For this week the group assignment is to Compare as many tool options as possible.
LabVIEW
LabVIEW is an engineering programming environment based on using blocks. It's usually used to create measurement systems and control them. In this page I'll present the interface I've created for a project I made using LabVIEW.
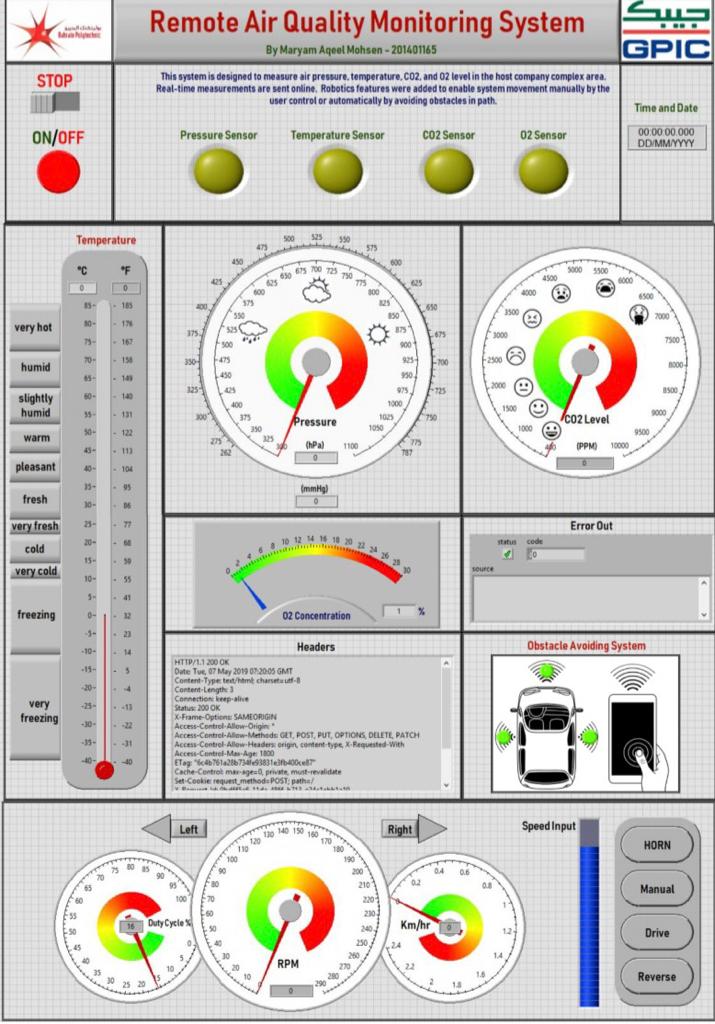
The project ia mainly a remote air quality monitoring system for the Gulf Petrochemical Industries Co. (GPIC) in Bahrain. The designed system can measure four important air quality parameters in the company complex, which are temperature, atmospheric pressure, carbon dioxide level, and oxygen level.
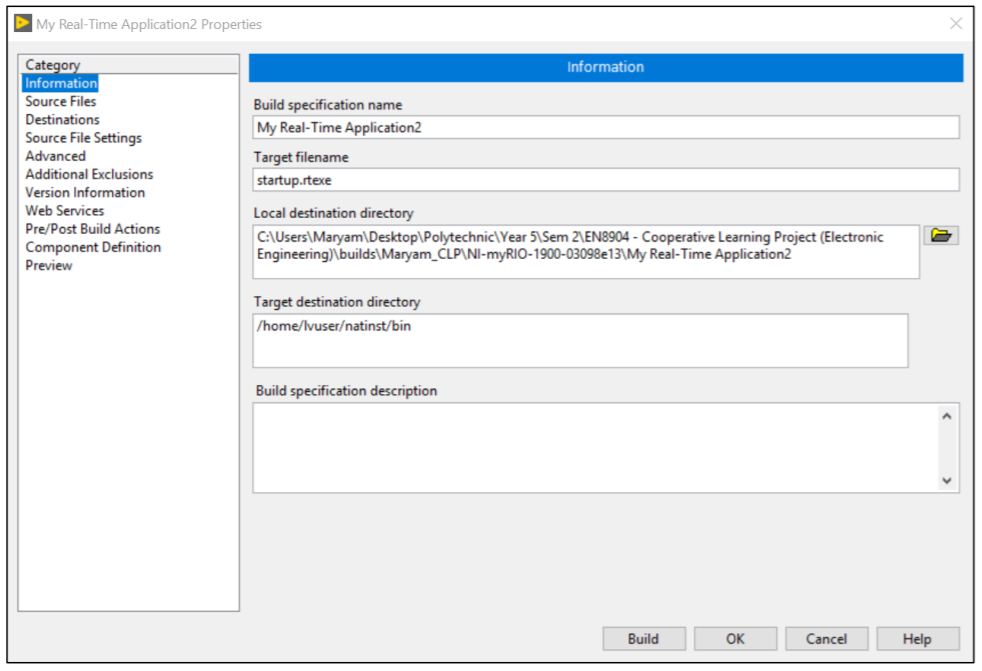
All the created LabVIEW SubVIs were inserted in a single main VI that being uploaded to the microcontroller device used of this project (i.e. myRIO 1900) as a real-time application. By building the main VI to myRIO, the system will operate automatically once myRIO is switched on without the need for LabVIEW system running on a PC. This will enable the system to operate as a stand-alone application.
The LabVIEW program is mainly do the following features:
- Display local time and date in the format of "00:00:00.000" and "DD/MM/YYYY".
- Measure atmospheric pressure and display measurement in two units, which are hectopascal (hPa) and millimeter of mercury (mmHg).
- Measure air temperature and display measurement in two units, which are Celsius (denoted °C) Fahrenheit (denoted °F).
- Measure carbon dioxide level (denoted CO2) and correct the measurement based on the correction percentage at each air temperature value. Correction result is then displayed in Parts Per Million (denoted PPM).
- Measure oxygen level (denoted O2) and display measurement as a percentage (%).
- Indicate the measurements state of each sensor. ON if, measurements are in the detecting range and OFF if not.
- Send sensors’ measurements online continuously to enable IoT (Internet of Things) of real-time operating system.
- Control the system movement manually by controlling the speed of motors and the direction of movement.
- Control the system movement automatically by setting the speed of motors by the user and avoiding the obstacles automatically if detected in path.
- Control the speed of motors using closed loop system and PI tuning controller.
- Display the speed of motors in three units, which are revolution per minute (RPM), Kilometer per hour (Km/hr), and duty cycle (%).
- Switch off the system automatically when the user press the STOP button.
The following figure shows the front panel of the LabVIEW main program page. All indicators and controls used in this project are shown in the following front panel and the block diagram.
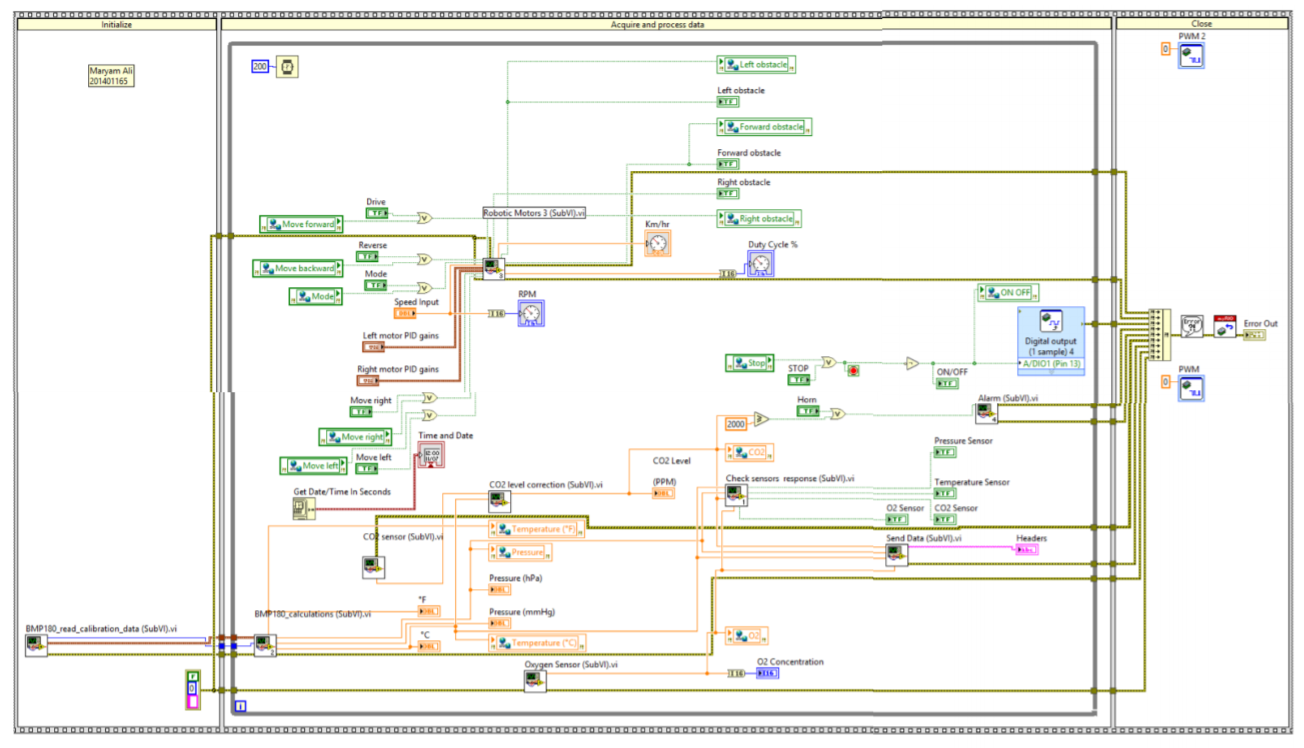
The following figure shows the block diagram of the LabVIEW main program page.
Data Dashboard LabVIEW
Another interface powered by LabVIEW is "Data Dashboard LabVIEW" for iPad. The system can be moved and controlled using LabVIEW data dashboard. The system can move in two modes, automatically by avoiding obstacles, or manually by the user control.
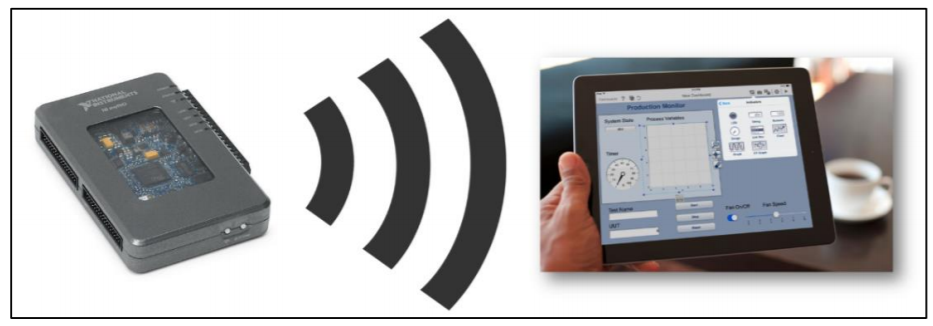
A platform (iPad) is used to control the air quality monitoring system through Wi-Fi. The following steps were followed according to the National Instruments official website.
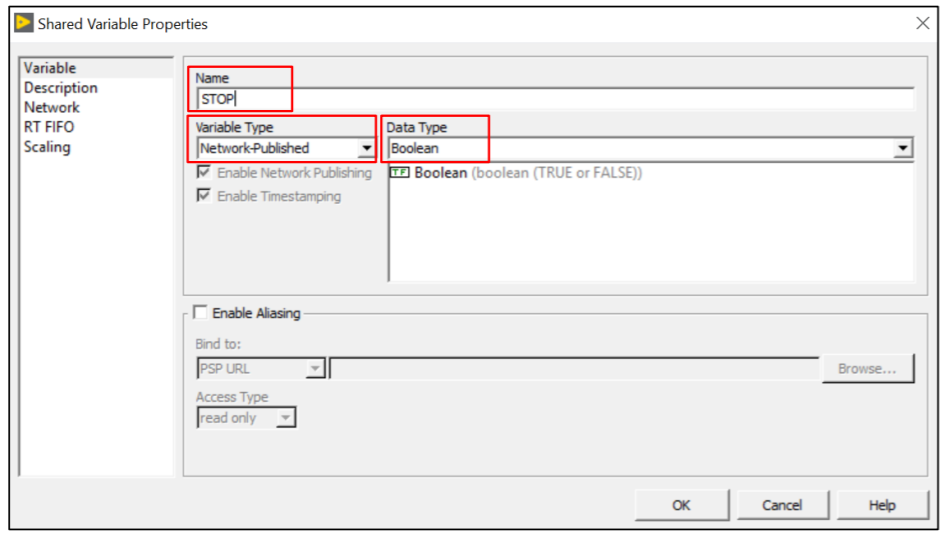
Step 1: From the project tree, right click pull-down menu, "New" ⟹ "Variable". "Shared Variable Properties" window is appeared. Set a name and a data type for the shared variable that will be used in the iPad LabVIEW data dashboard application. Repeat the step for each variable that required to be used in the iPad program.
Step 2: Network published shared variables were inserted in the LabVIEW main project page where needed and the access mode of each was set to "Read" or "Write" as required.
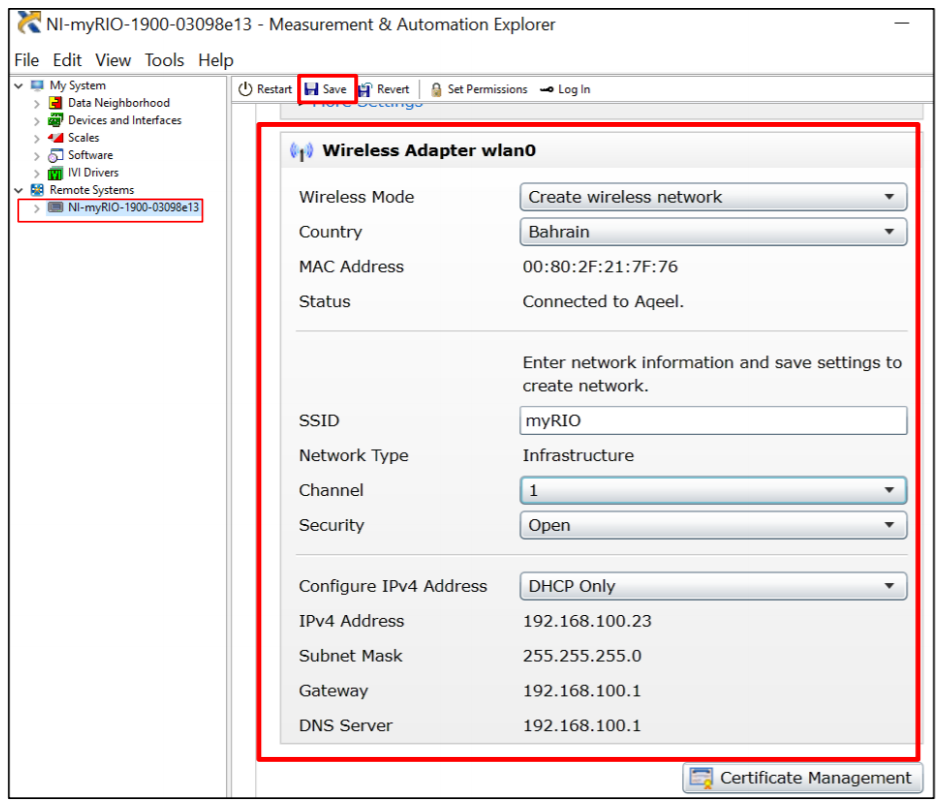
Step 3: Create wireless network using myRIO by setting the following settings in "NI MAX".
Step 4: Upload LabVIEW Data Dashboard application iPad.
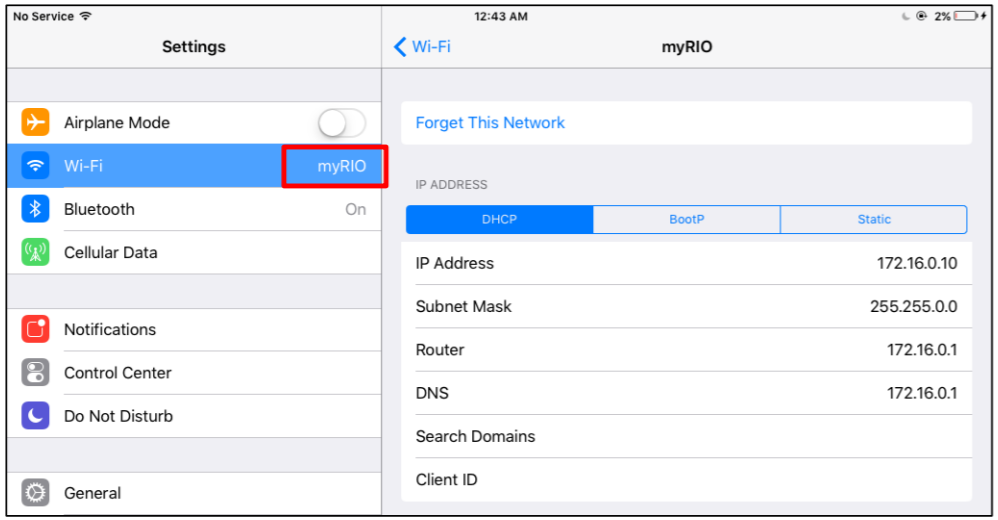
Step 5: Connect the iPad to the created wireless network “myRIO”.
Step 6: Add a palette (indicators, controls, and etc.) from the dashboard page.
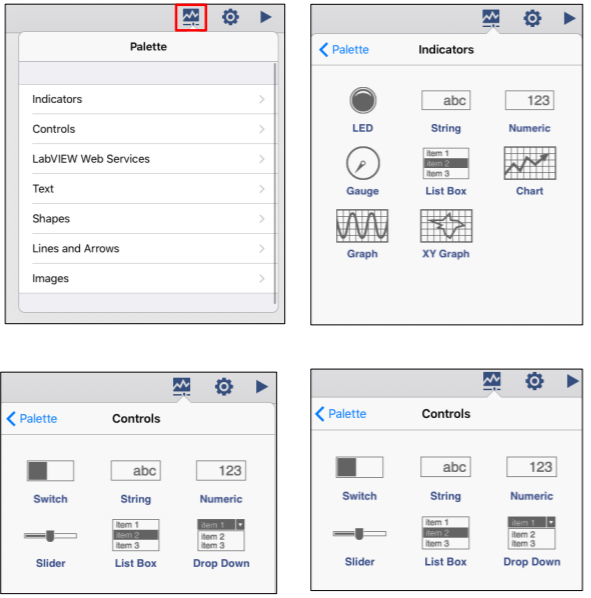
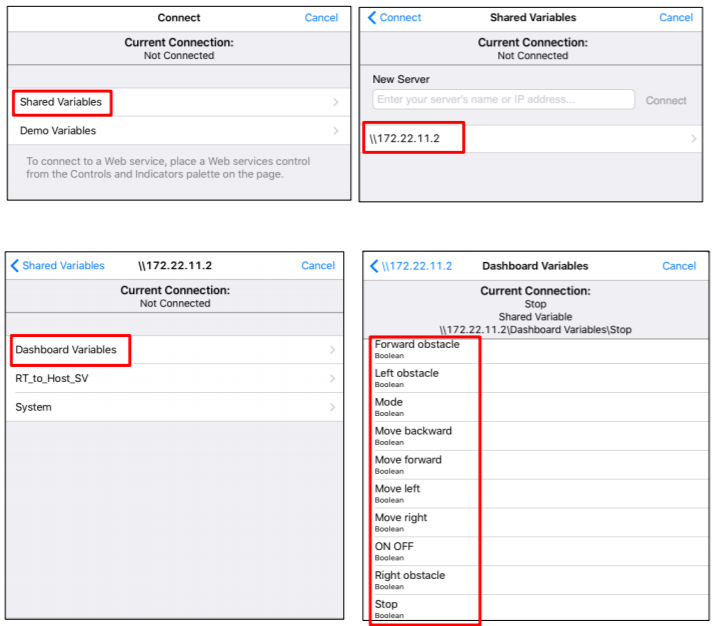
Step 7: Link the inserted palette to a shared variable from the myRIO LabVIEW project by tapping on the "Data Link" icon. "Connect" window will appear then ⟹ "Shared Variables" ⟹ "//172.22.11.2" ⟹ "Dashboard Variables". Variables can be set by choosing any of the shown shared variables.
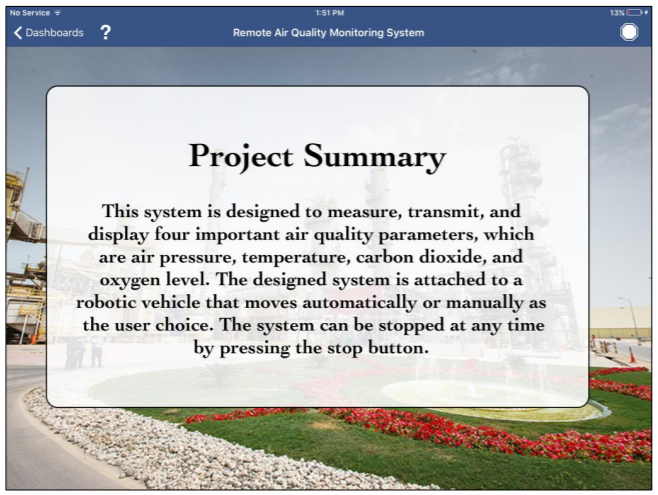
A collection of seven pages was created for the designed air quality monitoring system. The first page was the cover page that shows the title of the project, information about the author, the host company, and the university.

The second page of the data dashboard program is a brief summary that explains the program’s functionalities
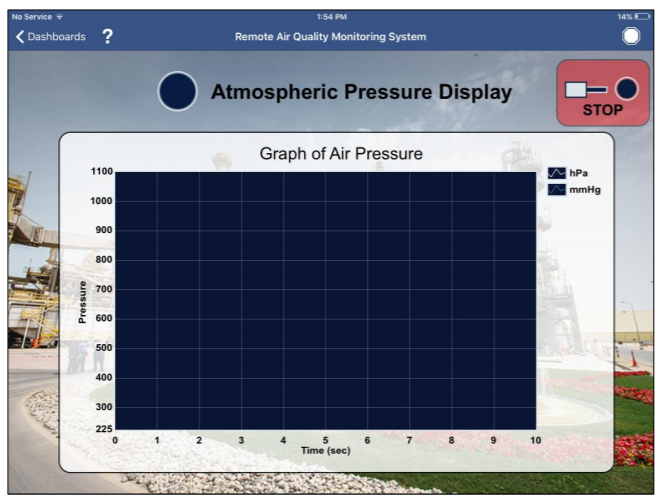
The third page of the data dashboard program was designed to display the atmospheric pressure using a time chart in two units, which are hectopascal (denoted hPa) and millimeter of mercury (denoted mmHg). The LED on the top left side is to indicate that the pressure sensor is working. While the LED on the top right side is to indicate that the system is running and the button is to enable the user to stop the system at any time.
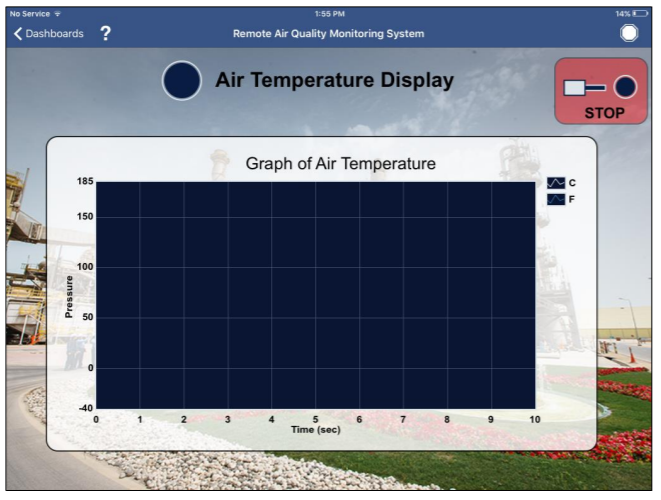
The fourth page of the data dashboard program was designed to display the air temperature using a time chart in two units, which are Celsius (denoted °C) Fahrenheit (denoted °F). The LED on the top left side is to indicate that the temperature sensor is working. While the LED on the top right side is to indicate that the system is running and the button is to enable the user to stop the system at any time.
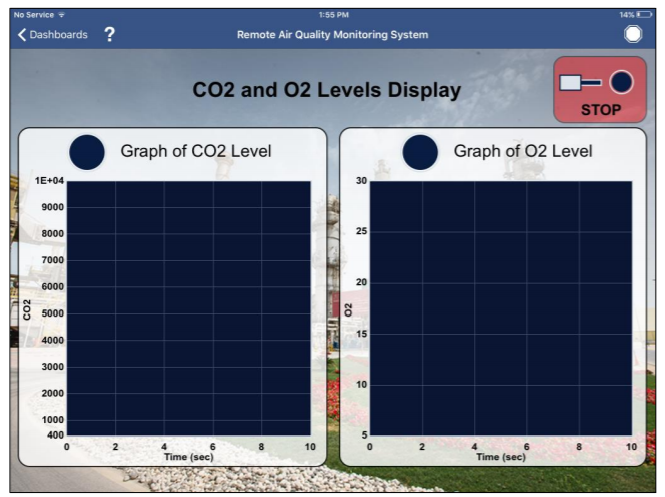
The fifth page of the data dashboard program was designed to display the carbon dioxide (CO2) in Parts Per Million (denoted PPM) and oxygen level (O2) in percentage (denoted %) using two separate time charts. The LED on the left side of the left chart title is to indicate that the carbon dioxide level sensor is working. While the LED on the top right side of the right chart title it to indicate that the oxygen level sensor is working. The LED on the top right side is to indicate that the system is running and the button is to enable the user to stop the system at any time.
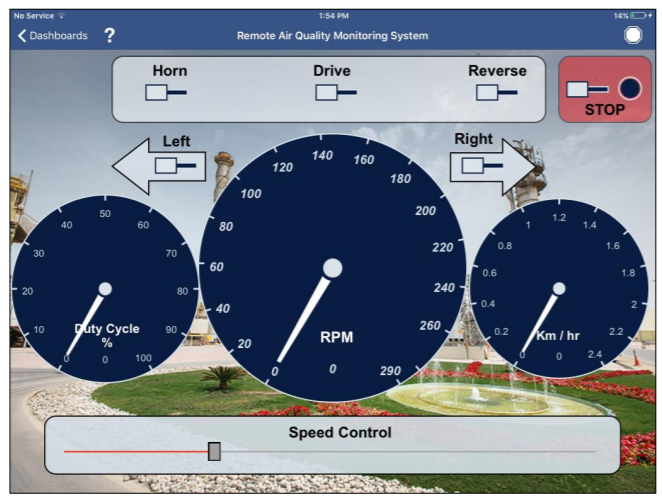
The sixth page of the data dashboard program was designed to allow the user to control the robotic vehicle movement in terms of speed, direction, and mode. In addition, this page was designed to indicate the speed of motors in three different units, which are revolution per minute (RPM), Kilometer per hour (Km/hr), and duty cycle (%). The LED on the top right side is to indicate that the system is running and the button is to enable the user to stop the system at any time.
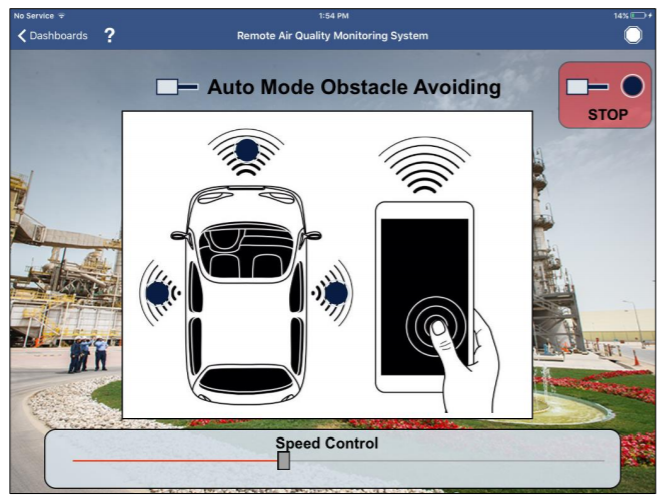
The sevenith page of the data dashboard program was designed to allow the user to choose the automatic movement mode for the robotic vehicle. If the user chose the auto mode, the speed of motors will be the only variable that can be set by the user. If an obstacle detected in the path of movement, the motors direction will be changed to the other direction. The LED on the top right side is to indicate that the system is running and the button is to enable the user to stop the system at any time.
Grasshopper
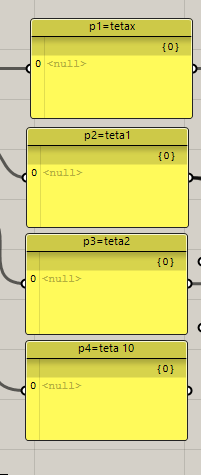
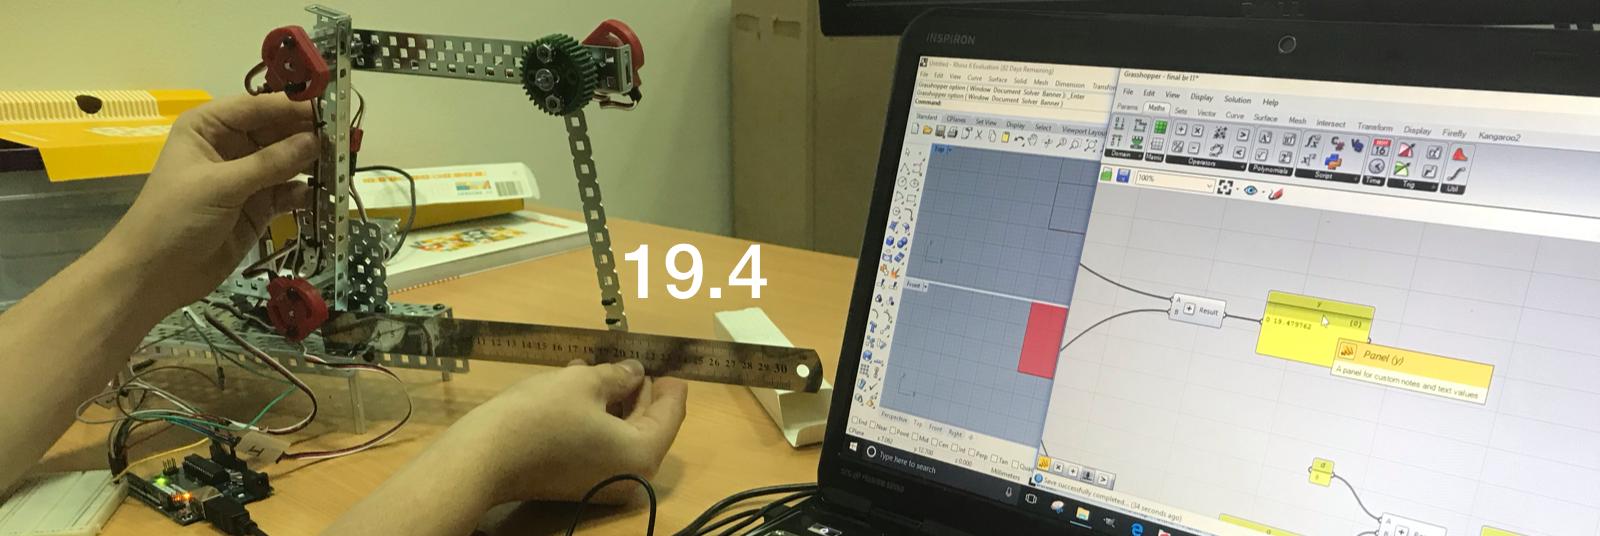
I used Grasshopper to help me solve equations and connect it with Arduino to give readings
Arduino
I linked Arduino to Grasshopper viaFirefly Firmata
Firefly
Steps and models in Firefly Firmata
Conductivity and equation
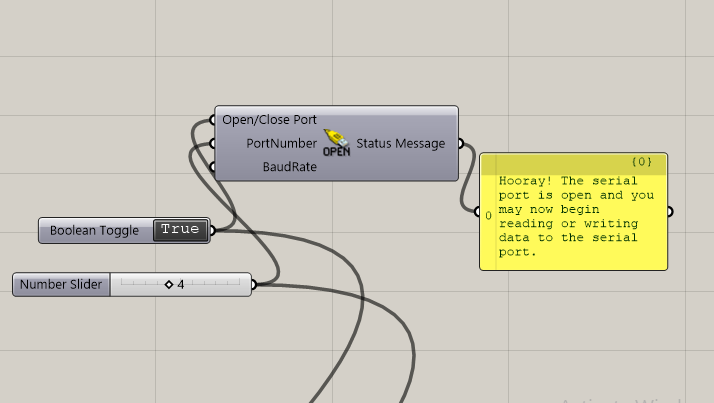
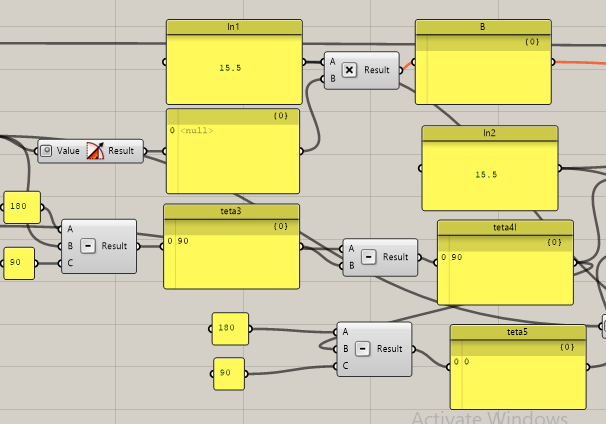
I made an Arduino connection with Grasshopper To make codes and equations with icons
- I put the board in use, which is Arduino Uno
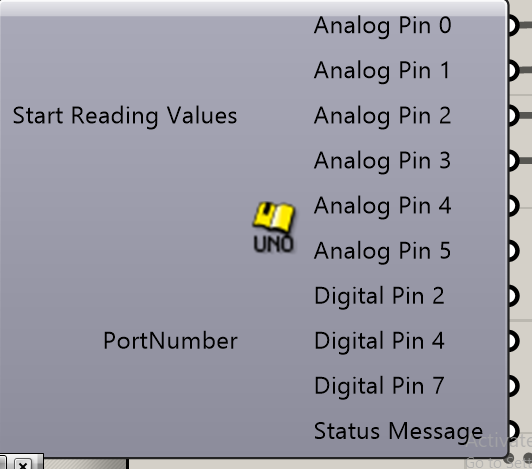
- I put a key to control and select the port
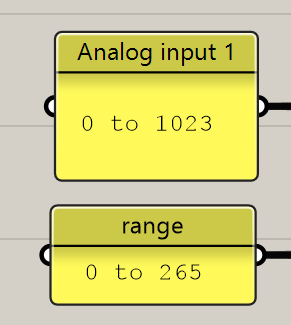
- You put the numbers for the variable resistance
- You named the entries
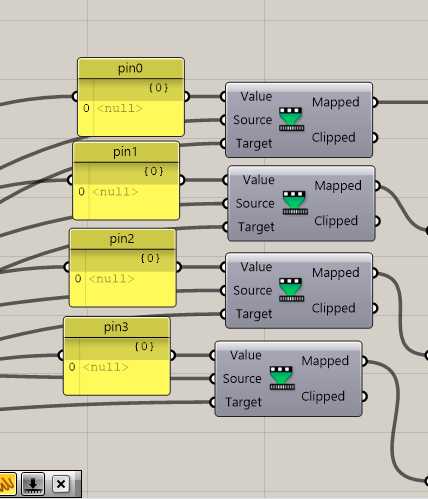
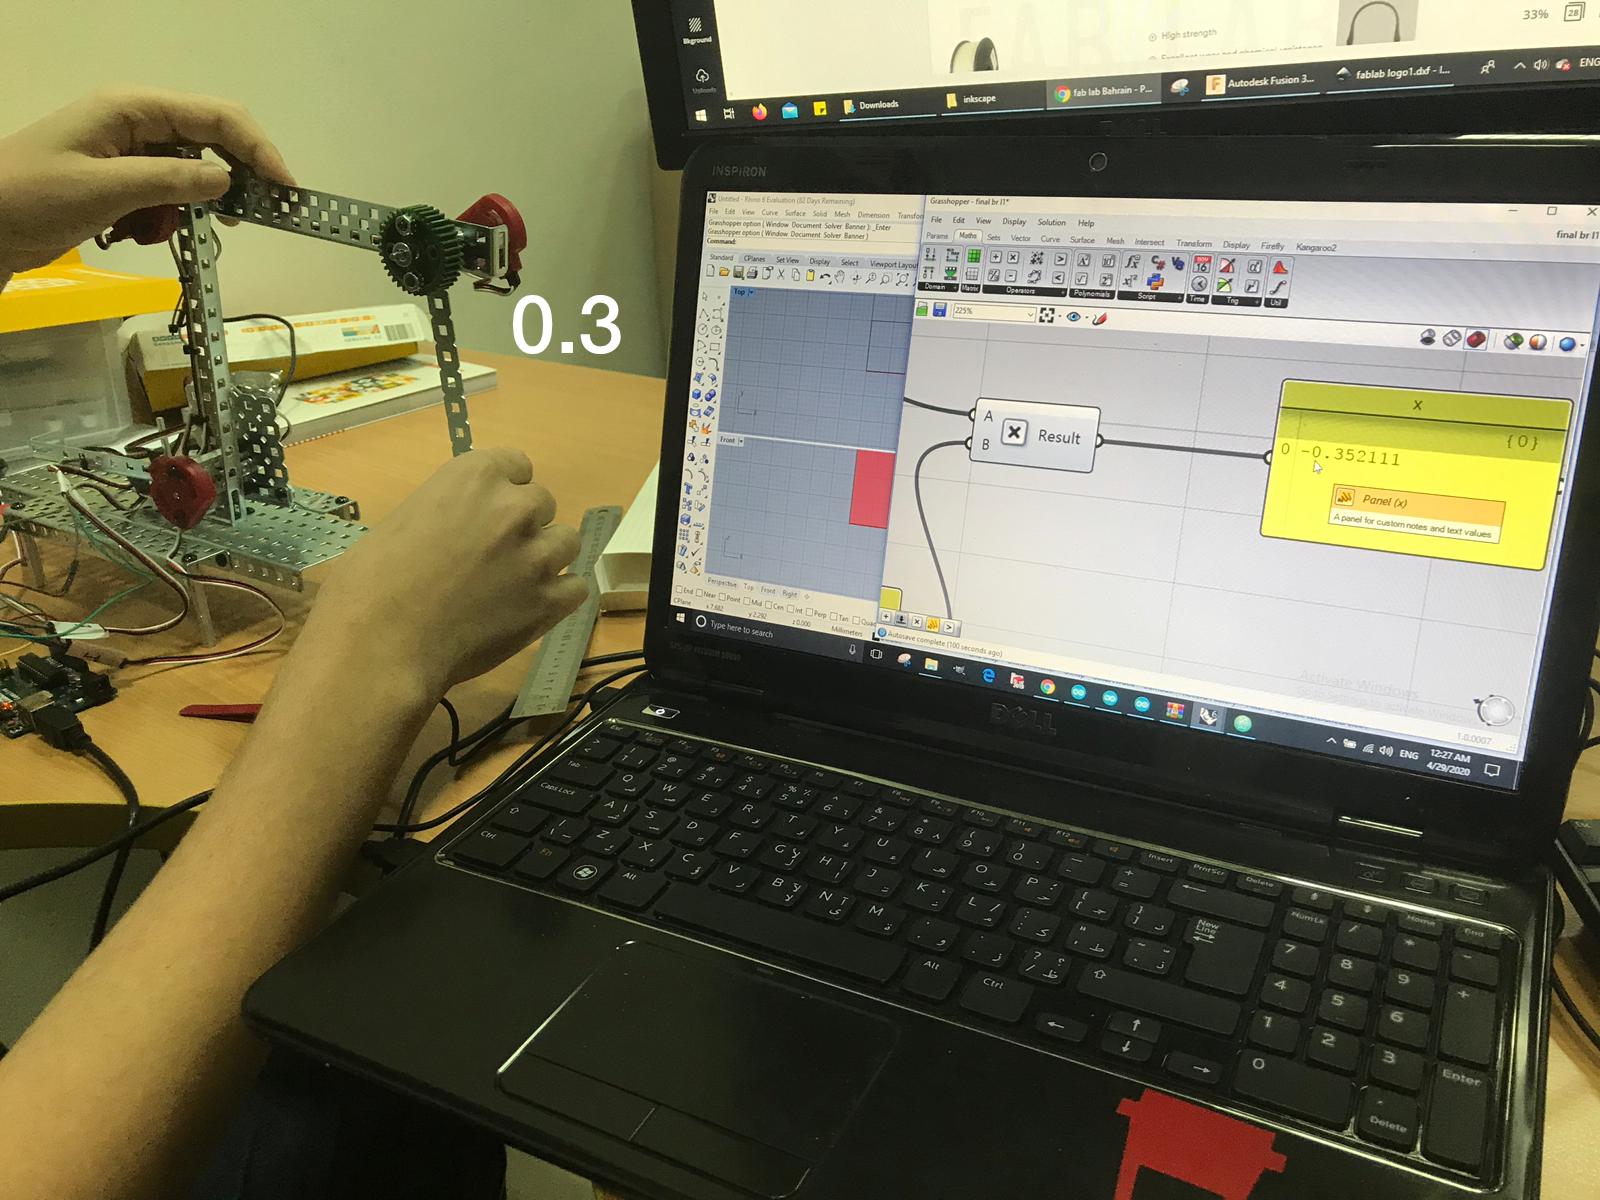
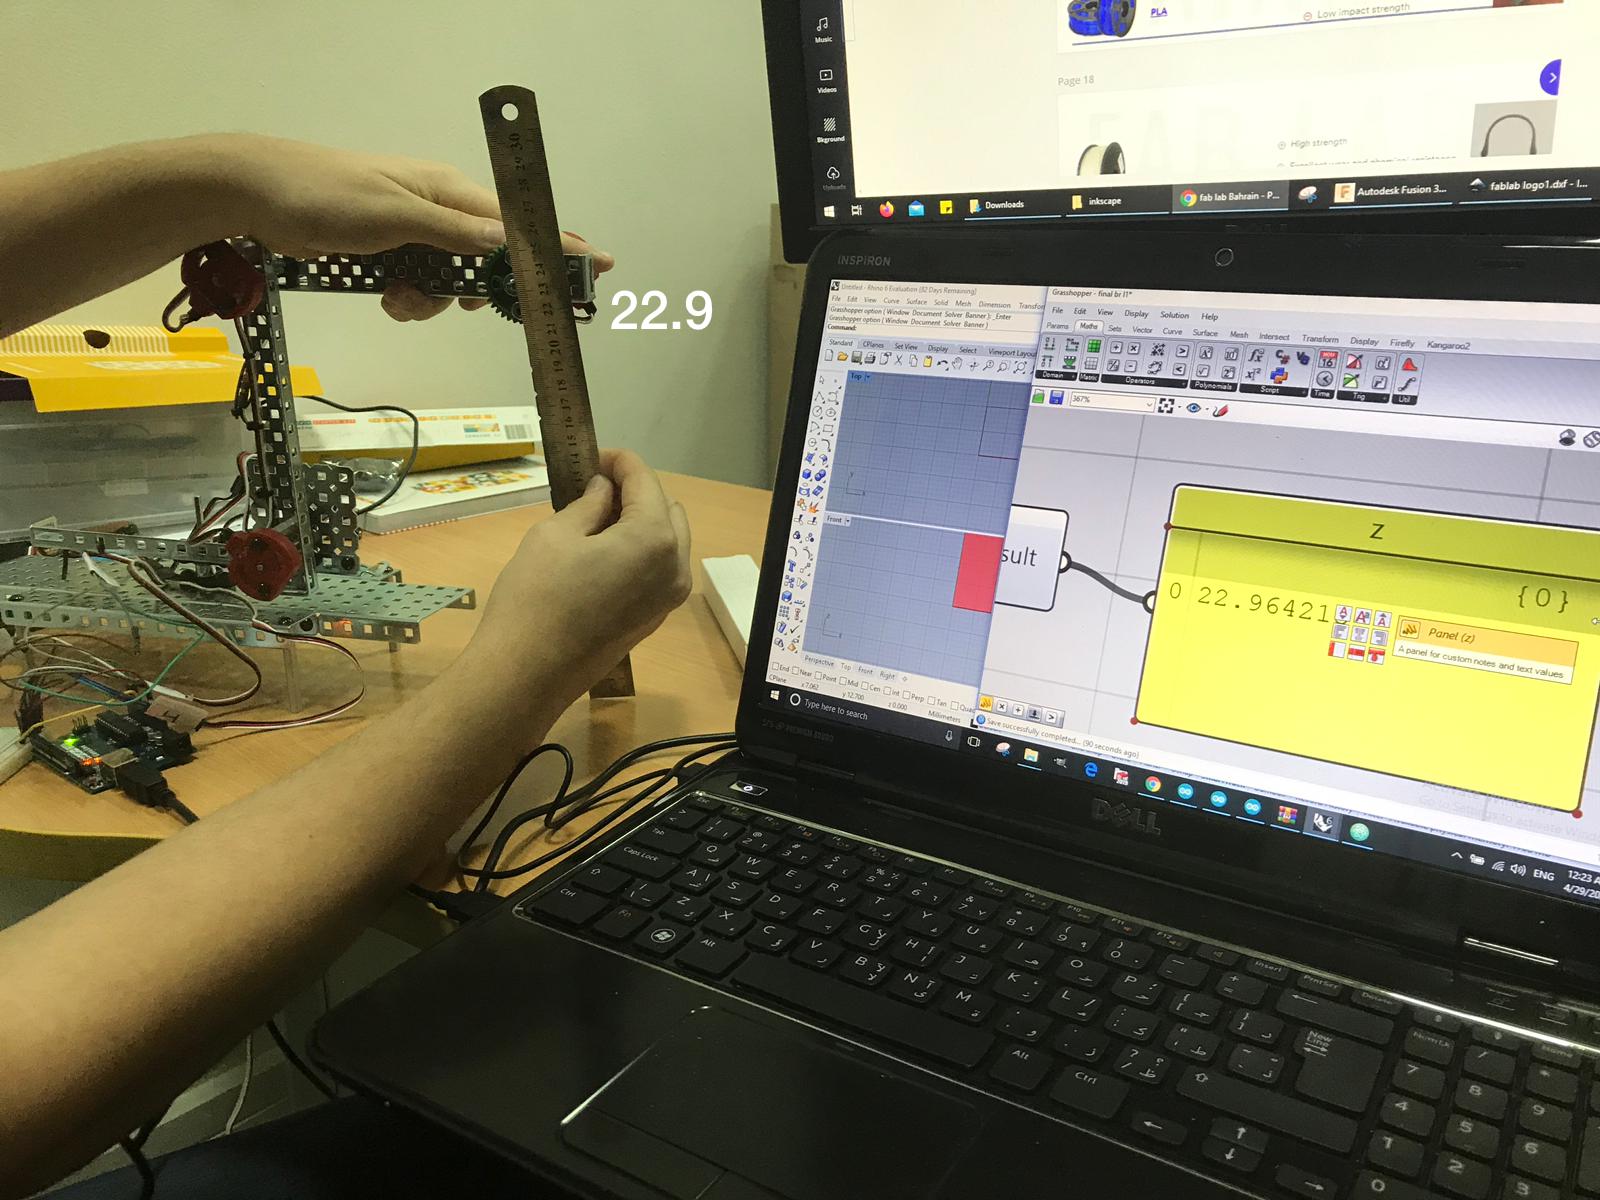
- I made icons to see the readings that variable resistance will give me
- I made the equation so that each number of numbers and readings made the next step and the process of multiplication and minus
- Continue the previous steps
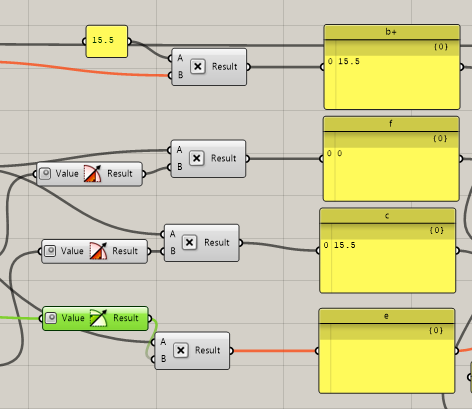
- Use another equation to do the final calculation of the XYZ axes
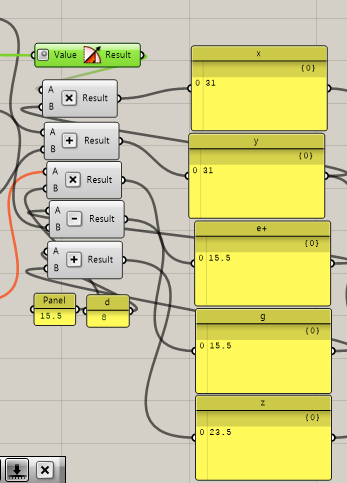
- Here XYZ readings are shown to me
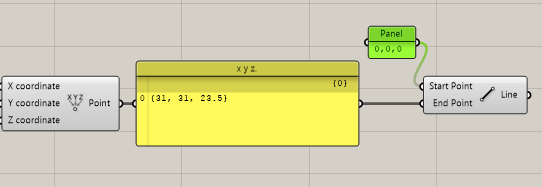
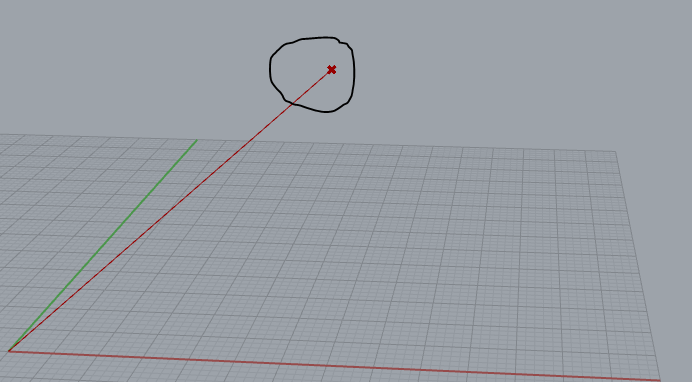
-And here I have a point in the 3D space
Confirm readings
- And here it shows me similar readings ( X axes)
- And here it shows me similar readings ( Z axes)
- And here it shows me similar readings ( Y axes)

Bluetooth Terminal HC-05 application
how it work
For more information about the device you can go to week Networking and communications for the details about the Bluetooth and for the screen you can go to week Output devices.
steps
first thing I did was to change the master with slave Bluetooth for the circuit, as you see the Bluetooth HC-05 blinking fast and this mean that it is ready to be connected with other things.
then I download the application Bluetooth Terminal HC-05
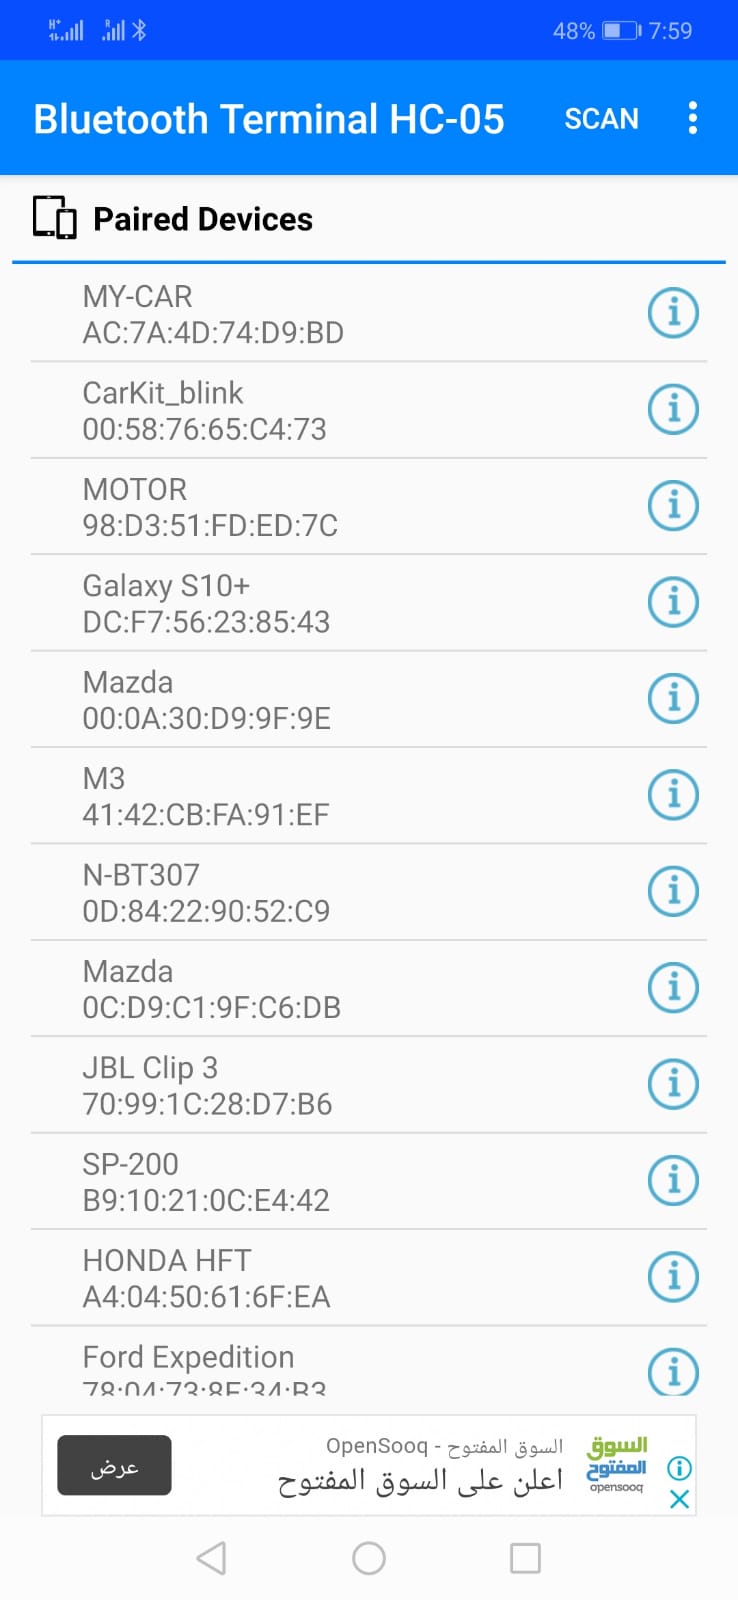
first thing I did when I open the application is scan about my circuit and it call motor.
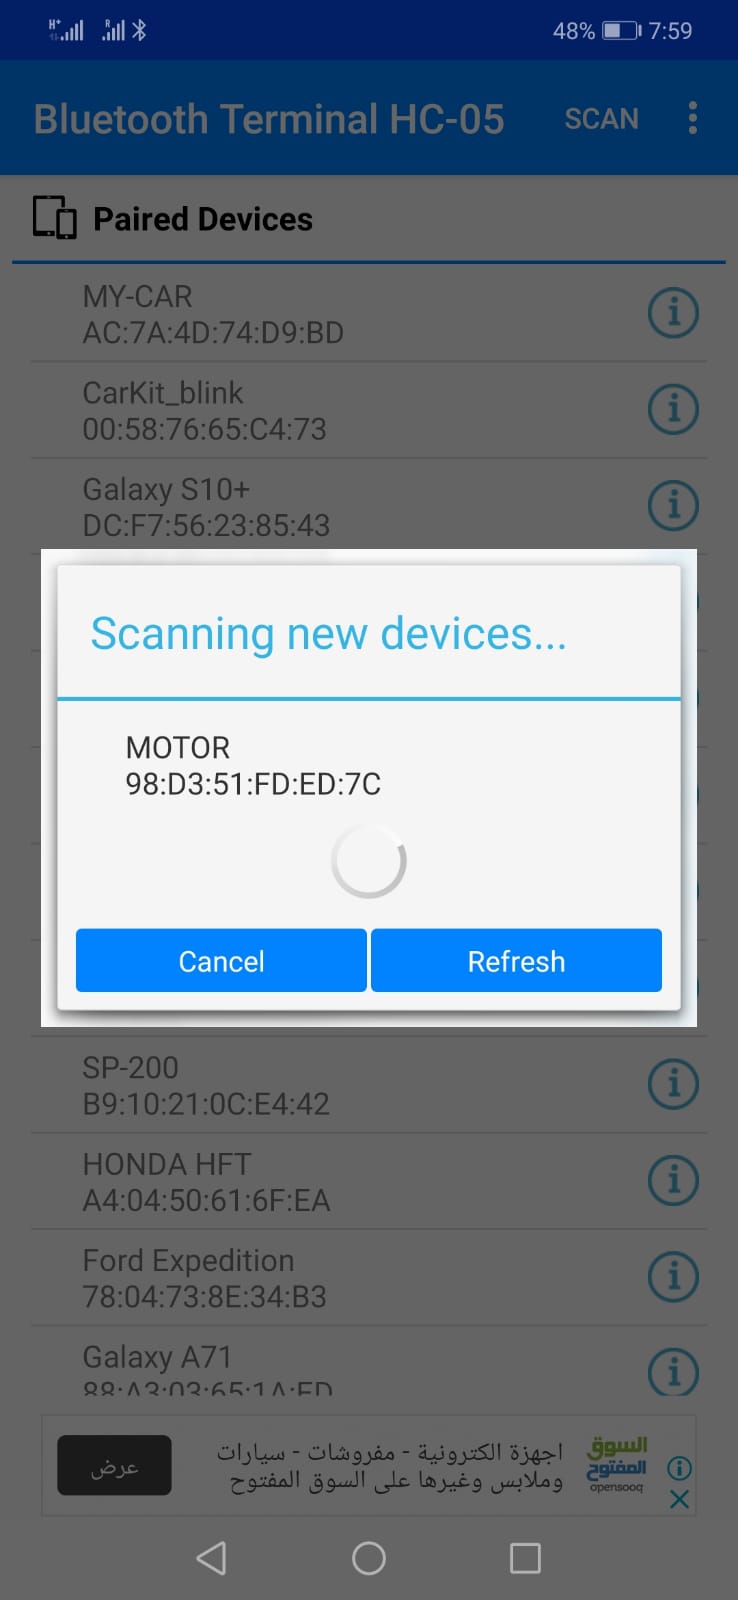 when I find it I press on it and connect
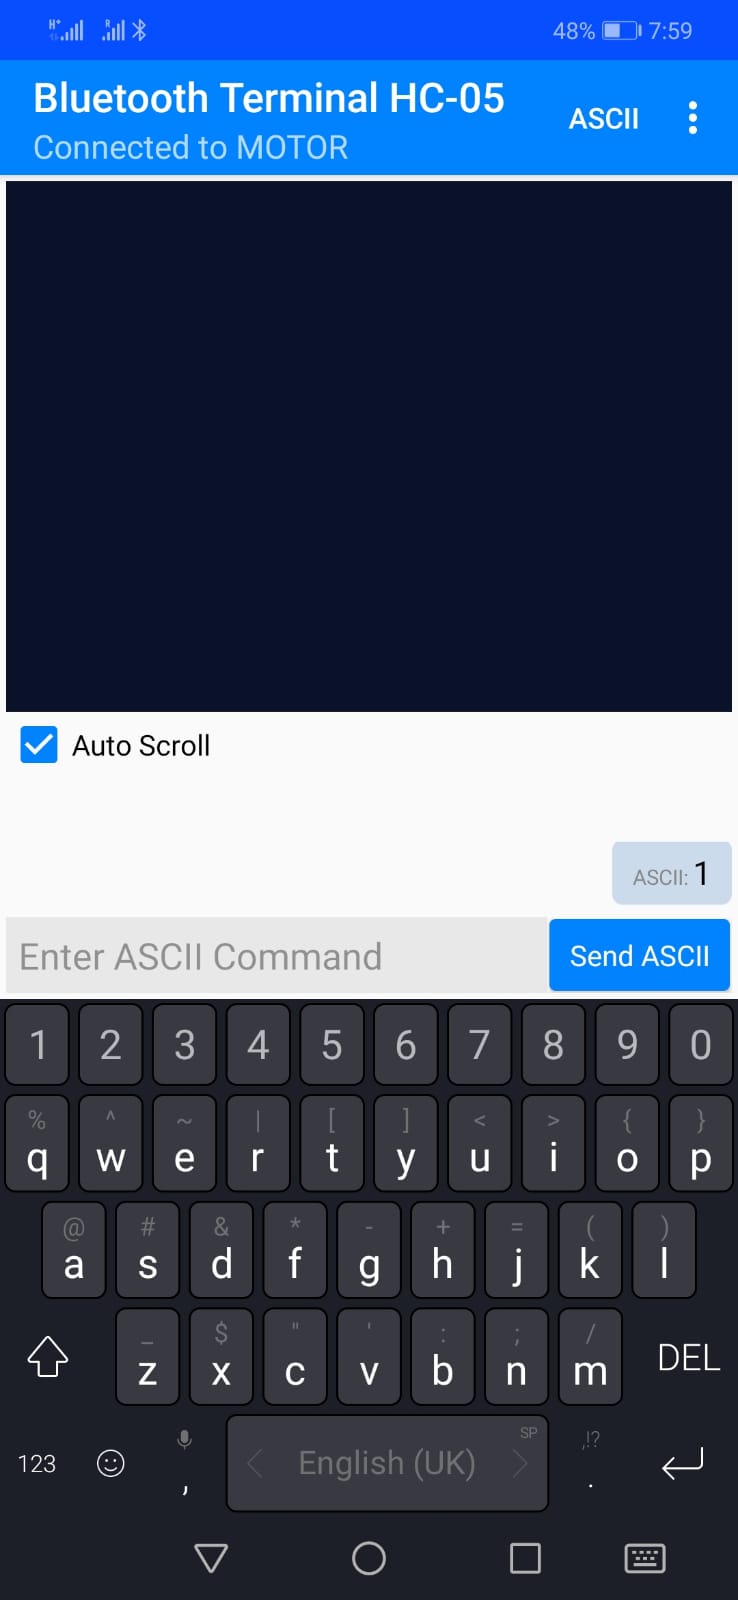 after this I white until it connected then I enter 1 whine it receive it the screen as it supposed to be and blink danger icon
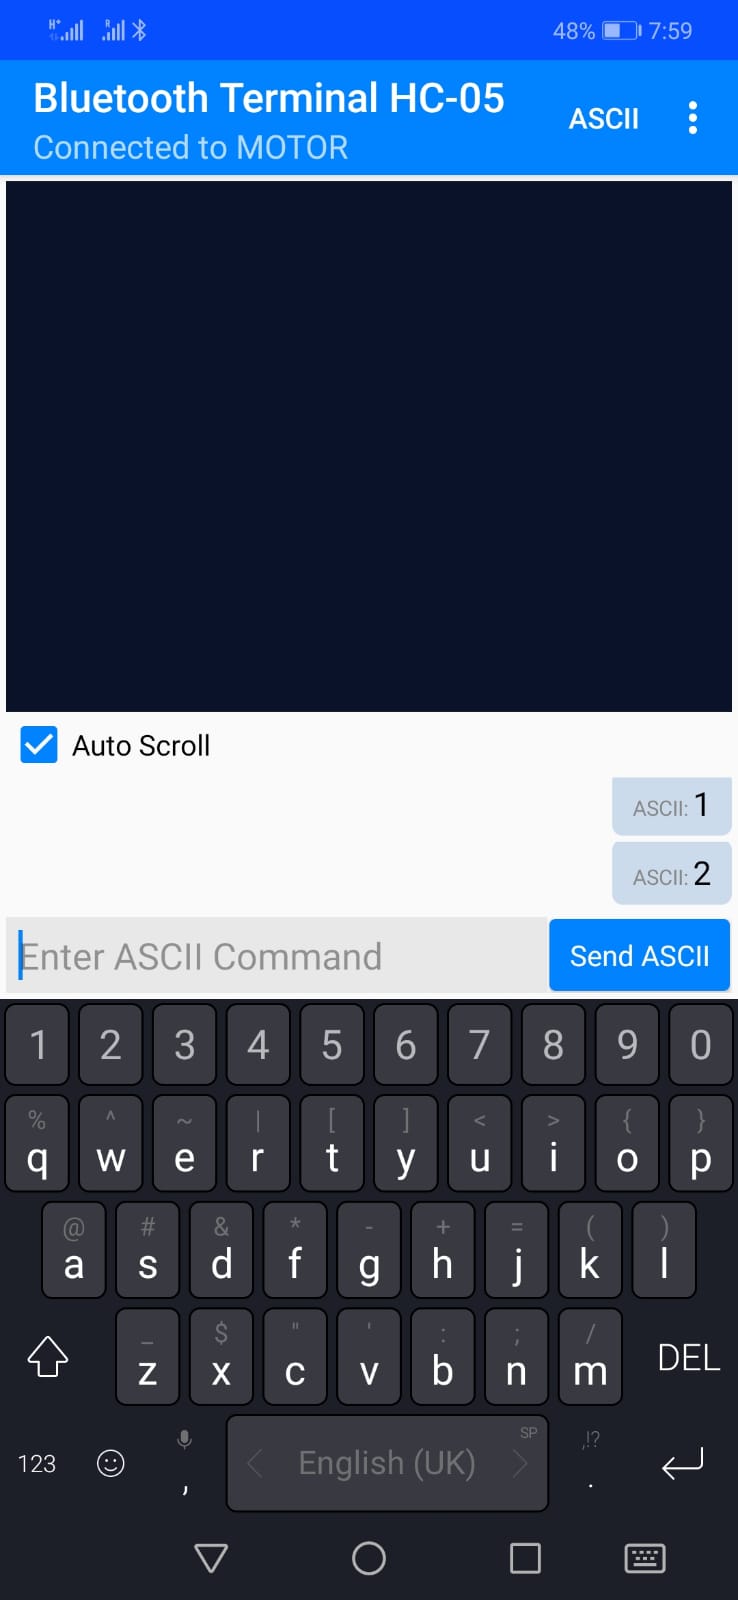
then I enter 2 and the screen blink danger the opposite side
as you see in this video
code
// the setup function runs once when you press reset or power the board
void setup() {
  // initialize digital pin LED_BUILTIN as an output.
  pinMode(LED_BUILTIN, OUTPUT);
}

// the loop function runs over and over again forever
void loop() {
  digitalWrite(LED_BUILTIN, HIGH);   // turn the LED on (HIGH is the voltage level)
  delay(1000);                       // wait for a second
  digitalWrite(LED_BUILTIN, LOW);    // turn the LED off by making the voltage LOW
  delay(1000);                       // wait for a second
}#include <Tiny4kOLED.h>
#include "SolomonSystech.h"
#include <SoftwareSerial.h>
SoftwareSerial mySerial(1,6); // RX1, TX6
// ============================================================================

void setup() {


  oled.begin();
  oled.clear();
  oled.bitmap(0,0, 128,4, logo);
  oled.on();
  delay(1000);
  oled.clear();

 mySerial.begin(9600);
}

void loop() {
  int x = 0 ;
 if(mySerial.available() > 0){
    x = mySerial.read();
 }

 if (x == '1')
 {
  oled.begin();
  oled.clear();
  oled.bitmap(0,0, 128,4, lift1);
  oled.on();
  delay(250);

  oled.begin();
  oled.clear();
  oled.bitmap(0,0, 128,4, lift2);
  oled.on();
  delay(250);

  oled.begin();
  oled.clear();
  oled.bitmap(0,0, 128,4, lift3);
  oled.on();
  delay(250);
 }

  if (x == '2')
  {
  oled.begin();
  oled.clear();
  oled.bitmap(0,0, 128,4, right1);
  oled.on();
  delay(250);


  oled.begin();
  oled.clear();
  oled.bitmap(0,0, 128,4, right2);
  oled.on();
  delay(250);

  oled.begin();
  oled.clear();
  oled.bitmap(0,0, 128,4, right3);
  oled.on();
  delay(250);
  }
  else {
  oled.begin();
  oled.clear();

  }
  }
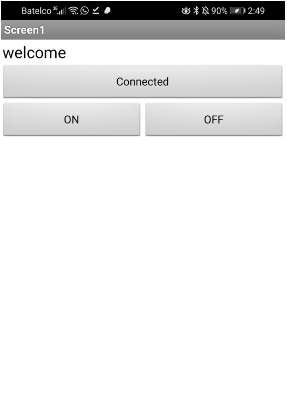
MIT APP
Application design
To design my application and write my code I used MIT APP INVENTOE
- Open the link provided above >> new project, if you have an account it will sign you in directly otherwise you can sign in with you google account.

- once you select new project a new window will open you with phone screen in the medal.
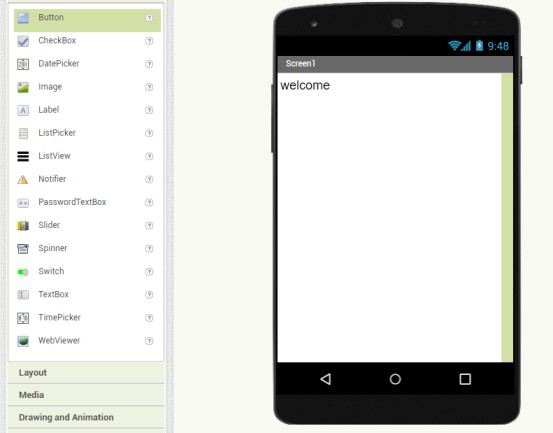
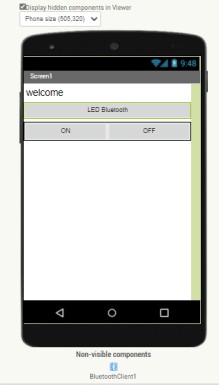
3.From the palette list go to user interface and drag the ListPicker to your phone screen and from properties list change the tittle of it to “LED Bluetooth” and the width to be fill parent
4.From the palette list go to Layout and drag the HorizontalArraignment to your phone screen and also change it is width to fill parent.
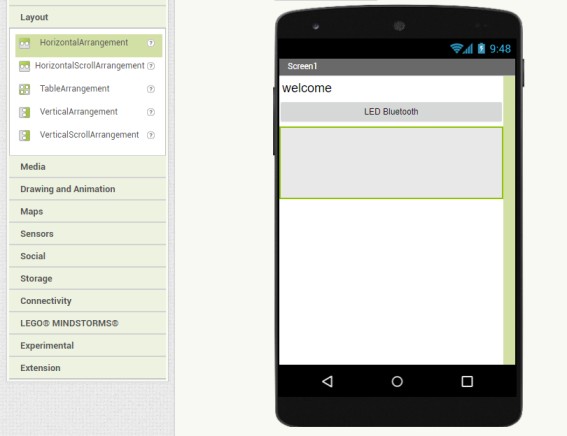

5.From the palette list go to user interface and drag two buttons and release them in the HorizontalArraignment and from properties list change the tittle of both of them one to “ON” and the other to “OFF” and also the width to be fill parent.
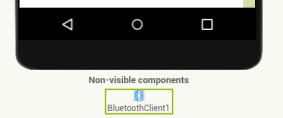
6.From the palette list go to Connectivity and drag the BluetoothClient to your phone screen you can see that the Bluetooth icon appear under the phone screen
The final reslut of the design step is shown below
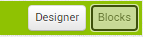
Application code
- click in block to start programming the application.
-
Once you select block a new window will the codes possible for the element that you select in designing.
-
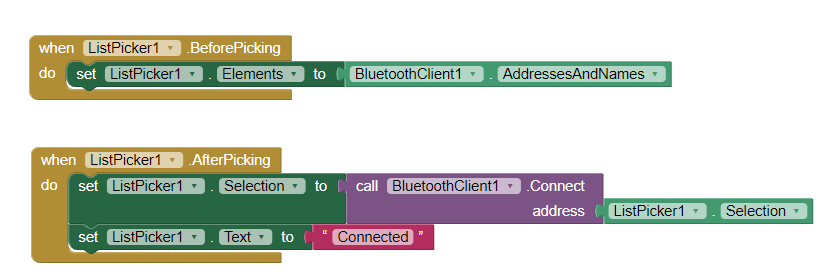
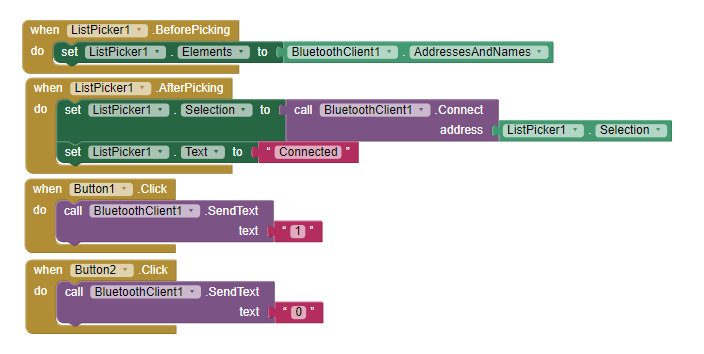
From the Blocks list select the ListPicker and bluetoothClinet insert the following blocks; the first block is before the selection of the Bluetooth device to show you the available Bluetooth devices. The second block is After selection to set that the application is connected to the desired Bluetooth.
- From the Blocks list select the Button and insert the following blocks; the first block is to send one when we click on the ON Button from the phone to the PCB to turn on the LED light and the second block is to send zero when we click to the OFF button to turn of the light.
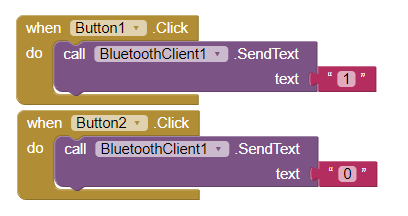
The final code is shown below
Download the app
- First download the MIT AI2 Companion app.
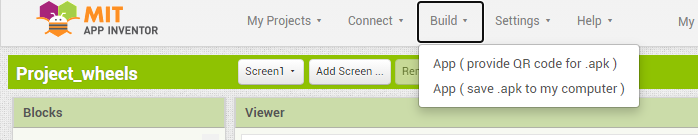
- from the MIT website go to bulit >> App (provide QR code for .apk).
- scan the code from the phone application.
- download the app that you made.
- open the App to check that is the same.
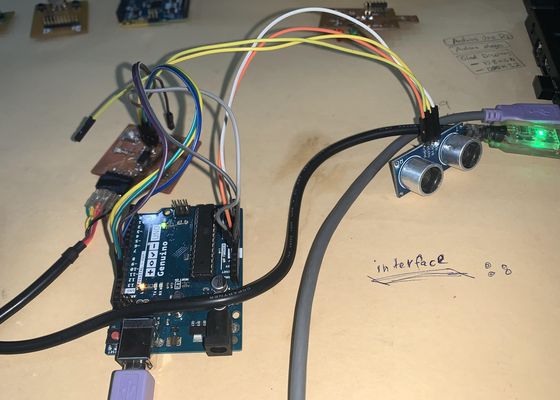
Hardware connection
The hardware that I used in this assignment are: 1. My PCB from week 10. 2. bluetooth module hc-05. 3. jumper wires. 4. bread board. 5. Arduino UNO as programmer.
To do the connection follow the these stepes 1. Connect the Tx from the blbluetooth module to the Rx in the PCB. 2. Connect the Rx from the blbluetooth module to the Tx in the PCB. 3. connect both the PCB and the blbluetooth module to 5v supply and GND.
Programming
To program the PCB I upload the following code:
I first defined the varable that will Come from the phone application via Bluetooth to be equal to zero. Then in void setup I use seria.begain because we will have a reserve that coming data from my phon application , then I defined the built in LED at pin 13 to be my output.
In void setup I started by if statement to check if the application is connected or not if yes we can enter inside the if statement and keep executing the code. Inside the if statement if we will save the reading coming from the application in the defined variable. If the reading is one the light in pin 13 will be on if zero the light will be off
char Incoming_value = 0;

void setup()
{
  Serial.begin(9600);
  pinMode(13, OUTPUT);
}

void loop()
{
  if(Serial.available() > 0)
  {
    Incoming_value = Serial.read();
    Serial.print(Incoming_value);
    Serial.print("\n");
    if(Incoming_value == '1')
      digitalWrite(13, HIGH);
    else if(Incoming_value == '0')
      digitalWrite(13, LOW);
  }
}
The final result of connetion and programming
Processing
HC-SR04 Ultrasonic
Here I am going to send data from Arduino to “Processing” over the serial port, to display ultrasonic measurement in new way. Start with downloading Processing by clicking here and follow these steps:
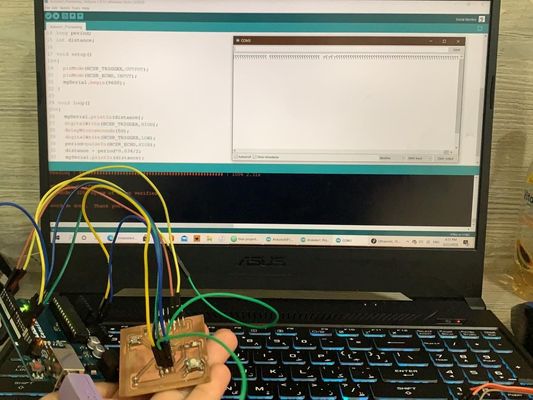
Here I am using Arduino UNO to provide power to the ultrasonic, and to program ATtiny44 board, also I am using here FTDI cable for serial communication as I will explain leter.
Arduino and Source Code
-
Set up the Arduino after connecting it, by uploading the “ArduinoISP” code to it.
-
Connect the ISP headers for the ATtiny44 PCB with Arduino pins, exactly as in Embedded Programming Weeek.
-
Also, follow the same steps in setting the board “tools” in Embedded Programming Weeek and upload the following code :
Arduino Code
“setup()” method where we set up our program. Here, we’re using it to make serial communication from the Arduino to our computer at a baud rate of 9600.
“loop()” method, used to repeat over and over as long as our program is running. In our code it will constantly take the distance reading and send it to the “Serial Monitor”. mySerial.println(distance);
Here is the code, I am going to connect ATtiny44 FTDI “RX” and “TX” to Arduino pins, “PA1” and “PA0” respectively. After uploading the code I am going to connect “Trig” pin to “MISO”, and the “Echo” pin to “MOSI” as I will explain later. It is possible to connect two jumper wires from “RX” and “TX” to the Arduino, and it is also possible to dispense from that by using the FTDI cable.
There is a difference between using jumper wires and the FTDI cable. When uploading the code using the jumper wires “COM3”, we separate the wires from one of the board because it does not accept uploading the code, and when we see the serial monitor, we do not change the port “COM3”. When using the FTDI cable, there is no need to remove it during uploading the code, but we use “COM3” before downloading the code, and “COM5” after downloading it to see the serial monitor.
// defines pins numbers
const int trigPin = PA5; //MISO
const int echoPin = PA6; //MOSI

// defines variables
long duration;
int distance;

#include <SoftwareSerial.h>
#define RXX PA1
#define TXX PA0

SoftwareSerial mySerial(RXX, TXX);


void setup() {
pinMode(trigPin, OUTPUT); // Sets the trigPin as an Output
pinMode(echoPin, INPUT); // Sets the echoPin as an Input
mySerial.begin(9600); // Starts the serial communication
}

void loop() {
// mySerial.println("testing");
// Clears the trigPin
digitalWrite(trigPin, LOW);
delayMicroseconds(2);

// Sets the trigPin on HIGH state for 10 micro seconds
digitalWrite(trigPin, HIGH);
delayMicroseconds(10);
digitalWrite(trigPin, LOW);

// Reads the echoPin, returns the sound wave travel time in microseconds
duration = pulseIn(echoPin, HIGH);

// Calculating the distance
distance= duration*0.034/2;

// Prints the distance on the Serial Monitor
mySerial.println(distance);

}
-
After the code is uploaded, disconnect the wires connected to “MISO” and “MOSI” of the ATtiny44 ISP headers. Now connect the ultrasonic as follow:
- UL GND - - ARDUINO GND
- UL VCC - - ARDUINO 3.3 V
- UL TRIG - - ISP MISO
- UL ECHO - - ISP MOSI
-
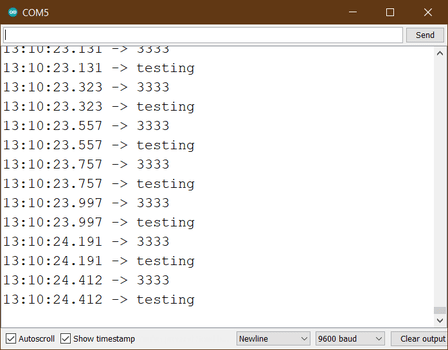
Here is the “Serial Monitor” showing the measured distance values.
Processing 3
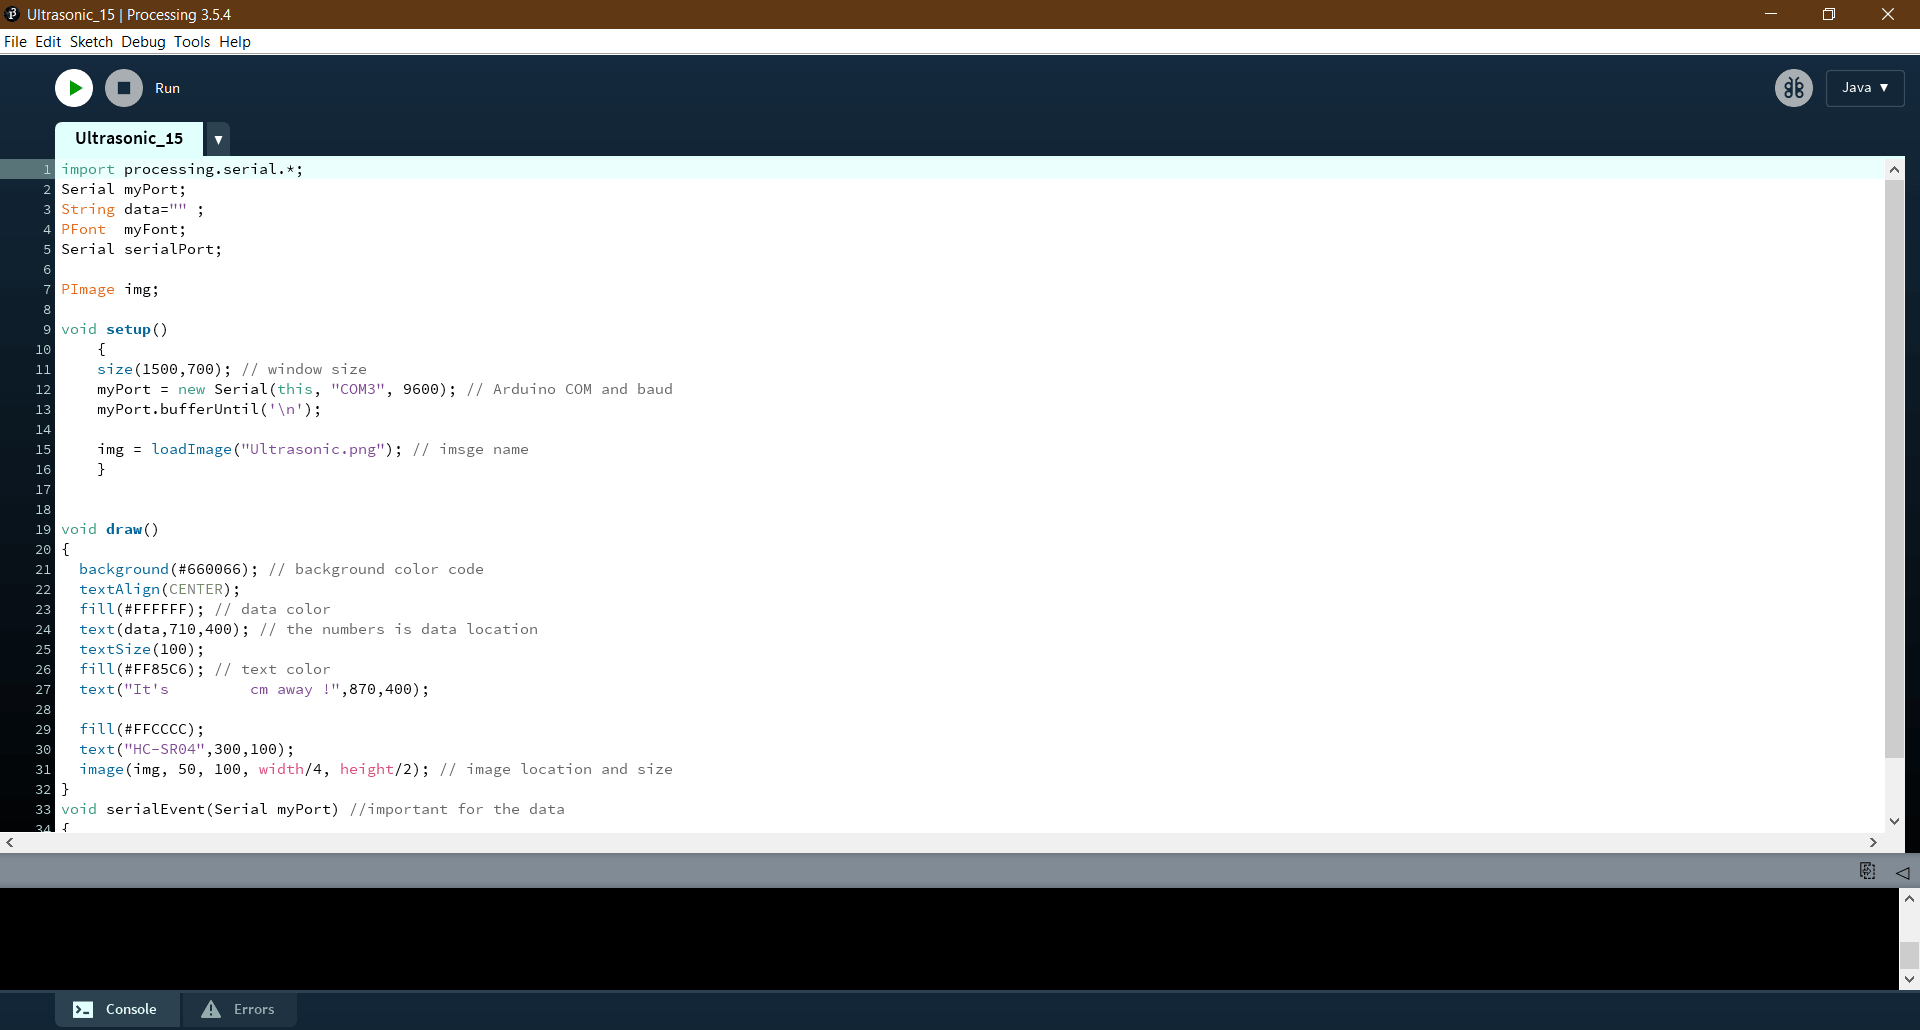
Now, move on to the “Processing” program. Processing uses the Java language to write the code, and since it is new to me, I read several pre-written codes, compared them, and searched for how to write a text and import images. This method is practical for learning how to code. Introduction to Processing is very useful.
First, import the “Serial” library from the “Sketch” menu > “Import Library”, which is to receipt what Arduino serial monitor is sending. import processing.serial.*; will be printed at the top of the sketch.
Processing Code
Serial myPort; listen to any serial communication, and for as to Arduino incoming data. String data="" ; is the data received from the serial port.
Just like Arduino has “setup()” and “loop()”, Processing has “setup()” and “draw()”.
setup() method, to set the serial port “COM” for which Arduino is connected, so Arduino and Processing are communicating at the same rate.
draw(), to take the data and display it, either in the black area at the bottom of the sketch, or in the window I chose for that. In this loop, I have specified the colors for the background and the size for the text, as well as the image.
Here I put several notes in the code, I know them by removing them and noting the comparison that occurs when viewing the result.
import processing.serial.*;
Serial myPort;
String data="" ;
PFont  myFont;
Serial serialPort;

PImage img;

void setup()
    {
    size(1500,700); // window size
    myPort = new Serial(this, "COM5", 9600); // Arduino COM and baud
    myPort.bufferUntil('\n');

    img = loadImage("Ultrasonic.png"); // imsge name
    }


void draw()
{
  background(#660066); // background color code
  textAlign(CENTER);
  fill(#FFFFFF); // data color
  text(data,710,400); // the numbers is data location
  textSize(100);
  fill(#FF85C6); // text color
  text("It's         cm away !",870,400);

  fill(#FFCCCC);
  text("HC-SR04",300,100);
  image(img, 50, 100, width/4, height/2); // image location and size
}
void serialEvent(Serial myPort) //important for the data
{
   data=myPort.readStringUntil('\n'); //important to display the data
}
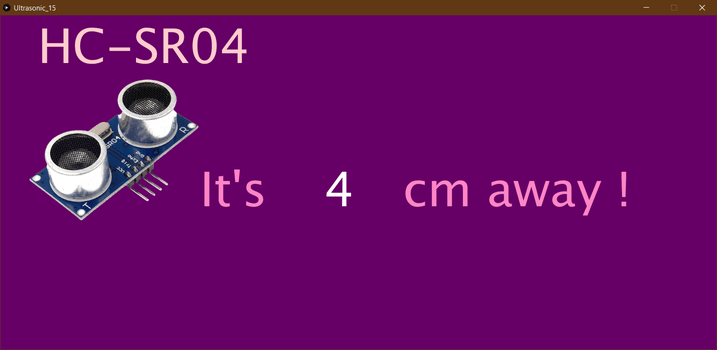
Click on the “Run” button, the circle in the top left of the screen to display the created window.
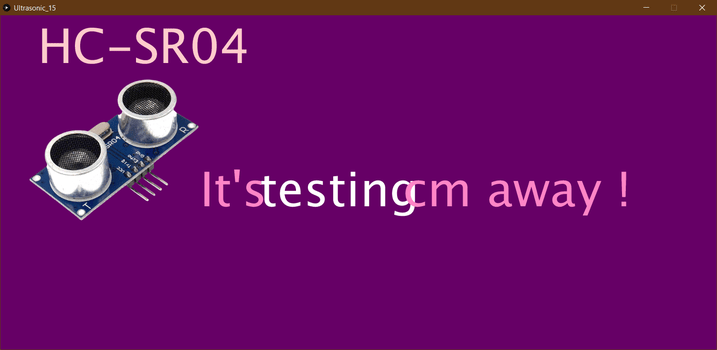
This is a screenshot of the window when displaying the readings.
This video shows the use of the ATtiny44 board to receive the ultrasonic readings and take them by the RX and TX to the Arduino that works as an ISP to deliver them to the Processing.
Problems
The same way I used it before, the result was on the serial monitor that only shows me question marks, I did “Burn Bootloader” but the same result.
After trying many times, finally, the result appeared in the serial monitor, which is the measurement of distance, as well as the word “testing” that I put to make sure the work of the serial monitor.
After the data appeared on the serial monitor, I moved to the processing program, but the result was that the data as well as the word “testing” appeared on the display window.
Files
Useful Links
- Processing Text Size
- Processing Importing Image
- Scaling an Image in Processing with Ultrasonic Sensor
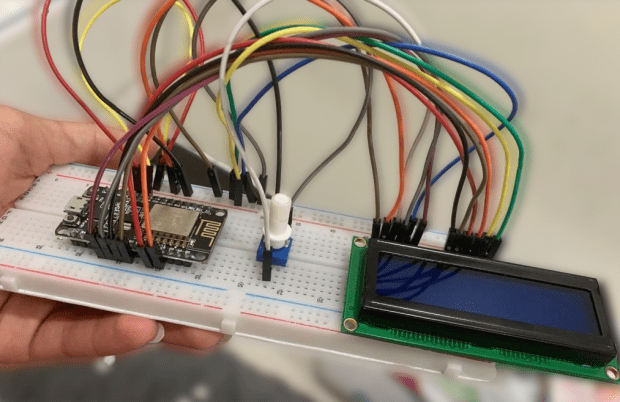
Liquid-crystal Display “LCD”
A Liquid Crystal Display is a display unit built using Liquid Crystal technology, and I used it to display text shows the temperature reading on the screen.
Connection
Source Code
I used this code to write my code. To see the code and the rest of the system details, open Networking and Communications week.
/*
 LiquidCrystal Library - Hello World


 Demonstrates the use a 16x2 LCD display. The LiquidCrystal
 library works with all LCD displays that are compatible with the
 Hitachi HD44780 driver. There are many of them out there, and you
 can usually tell them by the 16-pin interface.


 This sketch prints "Hello World!" to the LCD
 and shows the time.


 The circuit:
 * LCD RS pin to digital pin 12
 * LCD Enable pin to digital pin 11
 * LCD D4 pin to digital pin 5
 * LCD D5 pin to digital pin 4
 * LCD D6 pin to digital pin 3
 * LCD D7 pin to digital pin 2
 * LCD R/W pin to ground
 * LCD VSS pin to ground
 * LCD VCC pin to 5V
 * 10K resistor:
 * ends to +5V and ground
 * wiper to LCD VO pin (pin 3)


 Library originally added 18 Apr 2008
 by David A. Mellis
 library modified 5 Jul 2009
 by Limor Fried (http://www.ladyada.net)
 example added 9 Jul 2009
 by Tom Igoe
 modified 22 Nov 2010
 by Tom Igoe
 modified 7 Nov 2016
 by Arturo Guadalupi


 This example code is in the public domain.


 http://www.arduino.cc/en/Tutorial/LiquidCrystalHelloWorld


*/


// include the library code:
#include /search/%23include


// initialize the library by associating any needed LCD interface pin
// with the arduino pin number it is connected to
const int rs = D7, en = D8, d4 = D6 , d5 = D5, d6 = D4, d7 = D3;
LiquidCrystal lcd(rs, en, d4, d5, d6, d7);


void setup() {


 // set up the LCD's number of columns and rows:
 //lcd.begin(16, 2);
 // Print a message to the LCD.

}


void loop() {
 // set the cursor to column 0, line 1
 lcd.print("Good luck");
 delay(2000);
 lcd.clear();
 lcd.print("on the project");
  delay(2000);
 lcd.clear();
 delay(1000);


}
Result
This is the end result that will display the value of the temperature measured through BMP180 temperature sensor.
